Qualitative Research and Quantitative Research: Practical Guide for Teams
Discover qualitative research and quantitative research differences and when to apply each method for stronger product insights.

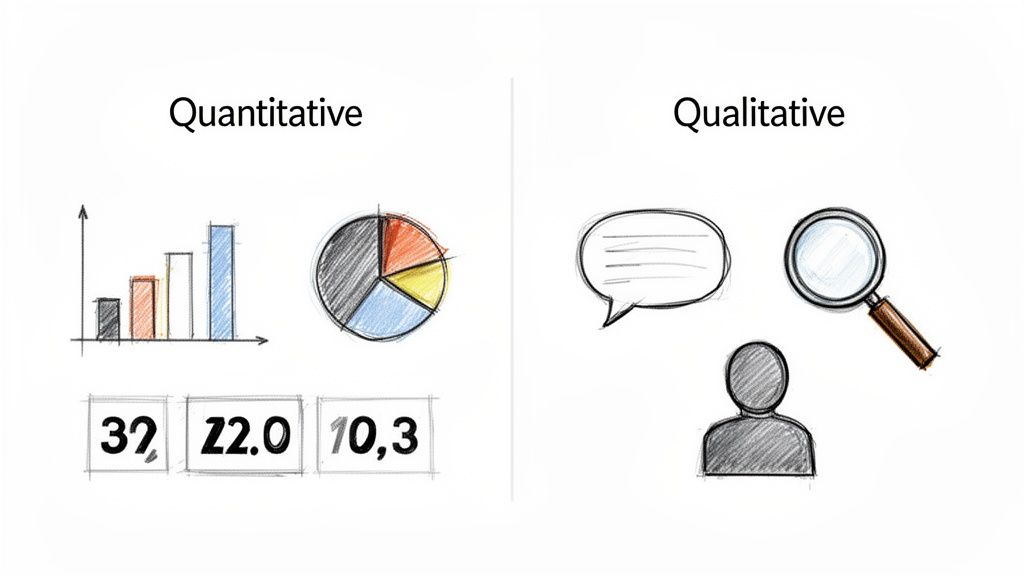
At its core, qualitative and quantitative research are all about answering fundamentally different questions. Think of it this way: quantitative research gives you the "what" and "how many". It's the numerical proof you need to spot trends and validate assumptions with hard data.
On the other hand, qualitative research delivers the "why". It dives into the human side of things, exploring non-numerical feedback like motivations, frustrations, and opinions to explain why people do what they do.
Building Products on a Foundation of User Truth
If you want to build products that people actually use and love, you need a clear picture of their needs, behaviours, and motivations. The two main ways we get this picture are through qualitative and quantitative research. Each gives you a unique lens to look through, and knowing when to use which is what separates mature product teams from the rest.
Let's say you've launched a new feature, but the adoption numbers are dismal. Your quantitative data—like analytics or an A/B test—can tell you that only 15% of users have clicked the new feature button. That’s a critical piece of information, but it doesn't tell you why. Is the button hard to find? Is the feature's value unclear? Is it just not solving a real problem?
That's where qualitative research steps in. Through methods like one-on-one user interviews, you can dig into the root causes behind that low engagement and hear directly from users what’s going on.
Practical Recommendation: When you spot a confusing metric in your analytics, immediately schedule 3-5 quick user interviews. This proactive step can turn a mysterious number into an actionable insight in just a few days. For even faster results, platforms like Uxia can give you qualitative feedback from synthetic users in minutes.
Numbers vs. Narratives
A simple way to remember the difference is to think about numbers versus narratives. Quantitative research is all about measurable, objective data points you can count. Qualitative research, in contrast, is about exploring subjective experiences and the context around them.
This fundamental difference shapes everything—from the questions you ask to the insights you walk away with.
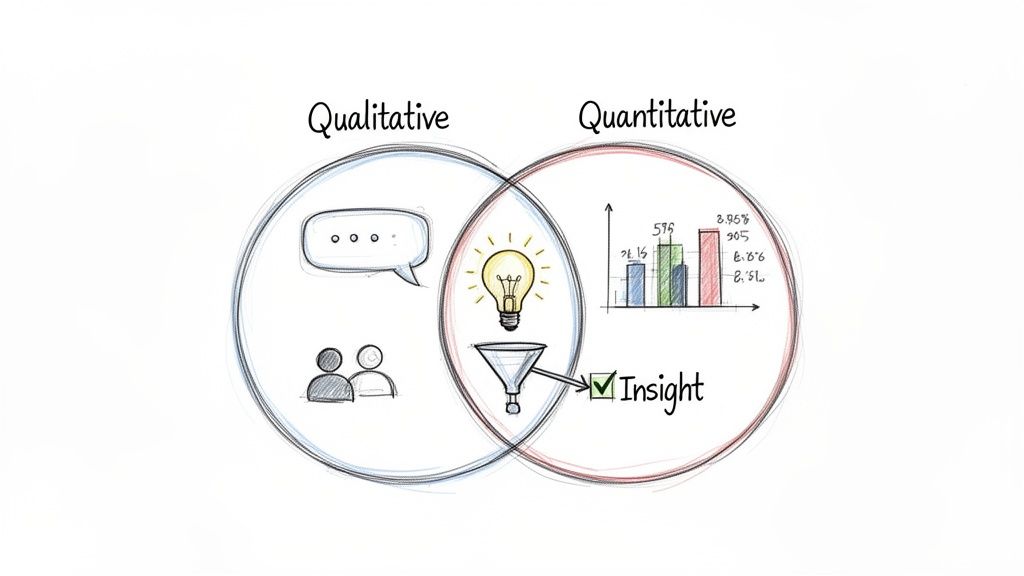
It's never about which one is "better." The real question is which one is right for the job you need to do right now. In fact, the most powerful insights usually come from blending both, giving you a complete, three-dimensional view of the user experience. This is how teams move from just observing behaviour to truly understanding it.
Qualitative vs Quantitative Research At a Glance
To make it even clearer, here’s a quick breakdown of how these two approaches stack up against each other.
Aspect | Qualitative Research | Quantitative Research |
|---|---|---|
Primary Goal | Explores ideas and uncovers the "why" behind behaviours. | Measures trends and validates hypotheses with numbers. |
Data Type | Non-numerical (opinions, motivations, observations). | Numerical (metrics, statistics, percentages). |
Sample Size | Small, focused group (e.g., 5-10 users). | Large, statistically significant group (e.g., hundreds or thousands). |
Common Methods | Interviews, focus groups, usability tests. | Surveys, A/B tests, analytics, biometric data. |
Questions Asked | Open-ended: "How did that feel?" "Why did you do that?" | Closed-ended: "How many times?" "On a scale of 1-5..." |
This table shows that your research goal directly determines the methods, data, and sample size you'll need.
Practical Recommendations for Getting Started
If your team is just starting to integrate these methods, the easiest first step is to map your research questions to the right approach.
If you're asking, "How many users are affected by this bug?" you need quantitative data. But if you're asking, "How does this bug frustrate our users?" you need qualitative insights.
Modern tools are also making it easier to bridge this gap. For example, a platform like Uxia lets teams get rapid feedback from synthetic users at scale. It can give you quantitative metrics like success rates right alongside qualitative "think-aloud" feedback. This approach blends the speed of quantitative analysis with the contextual depth of qualitative insights, streamlining the whole research process.
Right, let's move past the textbook definitions. The real magic happens when you see how qualitative and quantitative research play out in the wild—their goals, the methods they use, and how you actually make sense of the data you collect.
Each approach is built to answer completely different kinds of questions. Knowing the difference is what separates teams that make informed decisions from those just guessing.
Qualitative research is all about exploration. Its mission is to get a deep, almost personal understanding of why people do what they do. It’s not about numbers; it’s about uncovering the motivations, frustrations, and context behind user actions. Think of it as the 'why' detective.
Quantitative research, on the other hand, is built to be conclusive. It’s designed to measure, test, and validate ideas at scale. This is where you get your hard numbers—statistically significant data that lets you answer "how many?" and "how much?" with real confidence.
Contrasting Research Methods
Because their goals are so different, the methods for collecting data couldn't be more distinct. Qualitative is all about depth and direct interaction, while quantitative is engineered for scale and objectivity.
Qualitative methods are designed to pull out rich, descriptive stories, often by using open-ended questions in research to let users speak their minds. Common tactics include:
One-on-one User Interviews: Just sitting down and having a real conversation. This is where you dig deep into a user’s world, hearing their thoughts and experiences unfiltered.
Focus Groups: Getting a small group of users in a room (virtual or physical) to bounce ideas off each other. It’s brilliant for uncovering shared opinions and group dynamics.
Ethnographic Studies: Going into a user's natural habitat—their home or office—to see how they actually use your product. Context is everything here.
Quantitative methods are the opposite. They rely on structured data from large samples, stripping away ambiguity to get clean, countable results.
Surveys and Questionnaires: Sending out structured questions (like multiple-choice or rating scales) to hundreds or even thousands of people for standardised data.
A/B Testing: Pitting two versions of a design against each other to see which one performs better on a single, measurable goal, like sign-ups or clicks.
Web Analytics: Diving into the numbers from tools like Google Analytics to track what users are doing on your site—clicks, page views, time on page, you name it.
Practical Recommendation: Start by using quantitative analytics to identify where users are dropping off in your product funnel. Then, conduct targeted qualitative interviews with users who recently dropped off to uncover why they left. This two-step process is a highly effective way to diagnose and fix problems. For a faster approach, a platform like Uxia can provide both the 'where' (heatmaps, drop-off rates) and the 'why' (AI think-aloud feedback) in a single test.
How Data Analysis Differs
Once you have the data, what you do with it is also worlds apart. Qualitative analysis is interpretive and hands-on, while quantitative analysis is all about the stats.
With qualitative data, you're usually doing thematic analysis. This means painstakingly combing through interview transcripts or field notes, looking for recurring patterns, themes, and powerful quotes. The end result is a compelling story that explains user behaviour, backed by real-world evidence.
With quantitative data, you're running a statistical analysis. You’ll use software to crunch the numbers—calculating averages, finding correlations, and identifying trends. The findings are typically served up in charts and graphs, giving you a clear, numerical snapshot. To really get a handle on the different study types, you can explore a variety of behaviour research methods in our detailed guide.
Practical Recommendations for Product Teams
Here in Spain, a major hub for market research, quantitative has been king for a long time. Online surveys now account for over 60% of quantitative work in cities like Madrid and Barcelona, simply because they scale so well. For UX and UI pros, this trend makes the value of synthetic quantitative testing with a platform like Uxia crystal clear.
Think about it: traditional quant research means navigating bilingual recruiting hubs, a process that can burn weeks and thousands of euros. Uxia’s AI testers, however, deliver usability metrics instantly. This mirrors the broader shift in Spain toward cost-effective digital quant, a sector that grew 15% every year between 2019 and 2023. Product managers can now get rapid validation without the headaches and high costs of sourcing human participants. For a deeper dive into this trend, you can explore the full European market research report.
Practical Recommendation: If you need to validate a prototype with Spanish-speaking users, instead of spending weeks on recruitment, use a tool like Uxia to get instant quantitative feedback from AI personas configured for the Spanish market. This allows you to test localisation and usability assumptions in minutes, aligning with the market's shift toward fast, digital methods.
So, which one should you choose? Just look at the question you’re trying to answer. If you're exploring a new problem or trying to understand deep-seated user frustrations, start with qualitative. If you need to validate a design change or measure the success of a new feature, go quantitative for solid, reliable data.
When to Use Each Method in the Product Lifecycle
Deciding between qualitative and quantitative research isn't about which is "better." It's about knowing which tool to grab for the job at hand. A mature, data-informed team knows that applying the right method at the right time is what separates building features from solving real problems.
Think of your product's lifecycle as a journey. You wouldn't use a speedboat to climb a mountain, right? In the same way, you don't run a large-scale survey to explore a vague, undefined user problem. Each stage has its own unique terrain and demands the right tools to navigate it.
This decision tree offers a great starting point. It boils the choice down to your core question: are you trying to understand the "why," or do you need to know "how many?"
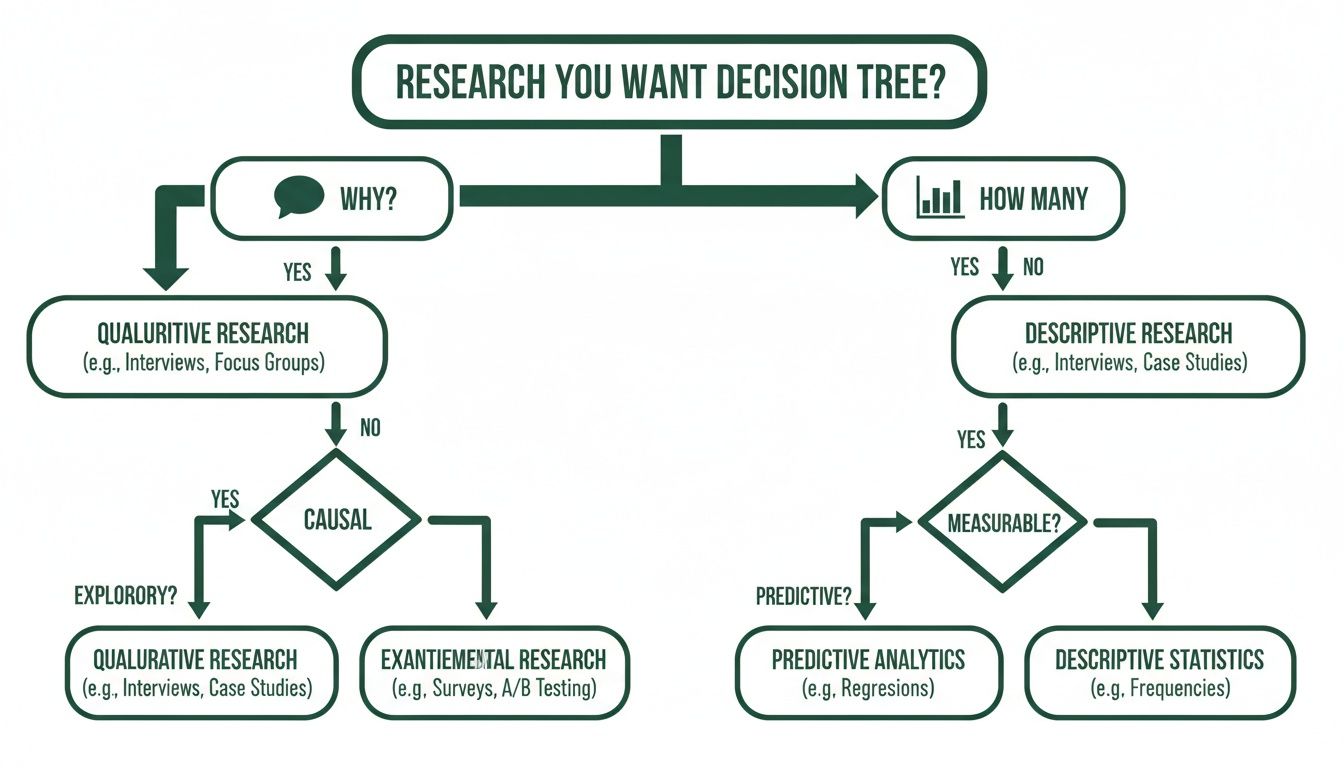
As the graphic shows, your foundational research questions will naturally lead you down one path or the other—either towards qualitative exploration or quantitative validation.
Early Stage: Uncovering Needs and Opportunities
Right at the beginning, you have more questions than answers. Your top priority is to gain a deep, foundational understanding. This is the discovery and exploration phase, where your goal is to pinpoint unmet user needs or simply validate if a problem is even worth solving in the first place.
This is where qualitative research is your best friend. Methods like one-on-one interviews or ethnographic studies let you immerse yourself in the user's world. You aren't hunting for statistical significance here; you're looking for those powerful, story-driven insights that can shape your entire product direction.
Practical Recommendation: Before you write a single line of code for a new feature, run 5–8 qualitative interviews. Just sit down and ask open-ended questions to uncover their real pain points. This tiny investment can save you months of building something nobody actually wants. A tool like Uxia can also help at this stage by testing early concepts to see if synthetic users understand the value proposition, providing an initial layer of validation.
Mid-Stage: Designing and Validating Solutions
Once you've landed on a strong hypothesis about a user problem, you shift into the design and prototyping stage. The goal is no longer broad exploration but focused validation. You need to find out if your proposed solution feels intuitive, is usable, and actually solves the problem you identified.
This is the perfect moment for qualitative usability testing. Watching just a handful of real users interact with a prototype gives you immediate, actionable feedback on what’s working and what's causing headaches. You can hear their thought processes and spot friction points that raw analytics would never show you.
Here's how that might look:
Scenario: You’ve designed a new checkout flow.
Qualitative Goal: Understand if users find the new flow intuitive and trustworthy enough to complete a purchase.
Method: Run moderated usability tests with a simple, clickable prototype.
Outcome: You'll identify specific UI elements that are causing hesitation or confusion long before development even starts.
Practical Recommendation: Use Uxia for rapid design iteration during this stage. Before you schedule moderated tests with humans, run your Figma prototype through Uxia to catch obvious usability issues first. This ensures that your valuable time with real users is spent on uncovering deeper, more complex insights rather than simple UI flaws.
Late Stage: Launching and Optimising at Scale
After your product or feature goes live, the game changes completely. Now you’re in the launch and optimisation phase, and your focus shifts to measuring impact, monitoring performance, and making iterative improvements based on real-world usage.
This is where quantitative research steps into the spotlight. Large-scale data from A/B tests, analytics, and surveys tell you definitively what is happening. It lets you validate changes with statistical confidence and track key performance indicators (KPIs) over time.
For instance, after launching that new checkout flow, you could run an A/B test against the old version. Your primary metric would be the conversion rate, giving you a clear, numerical answer on which design performs better. To see how to connect these numbers back to your design process, check out our guide on embracing data-driven design.
A practical way to bridge the gap between qualitative insights and quantitative validation is to use platforms like Uxia. Its AI testers can rapidly test design iterations, providing hard metrics like task success rates alongside qualitative "think-aloud" feedback. This creates a much faster feedback loop, allowing your team to validate fixes and optimisations without the logistical delays of recruiting human participants.
Matching Research Methods to Your Product Stage
To make this even clearer, here’s a simple table that maps research methods to the different stages of product development. Think of it as a quick cheat sheet for choosing the right approach.
Product Stage | Primary Goal | Recommended Qualitative Method | Recommended Quantitative Method |
|---|---|---|---|
Discovery & Ideation | Identify unmet needs; validate problems | 1-on-1 Interviews, Ethnographic Studies | Market Surveys, Competitor Analysis |
Prototyping & Design | Test usability and comprehension | Moderated Usability Testing, Think-Aloud Protocol | Preference Tests, First-Click Tests |
Launch & Pre-Release | Validate solution at a small scale | Beta Testing Feedback Sessions, Diary Studies | A/B Testing, Performance Benchmarking |
Post-Launch & Optimisation | Measure impact; identify areas for improvement | User Feedback Surveys (with open-ended questions) | Analytics Review, Funnel Analysis, Heatmaps |
This table isn't rigid—sometimes you'll mix and match—but it provides a solid framework for aligning your research efforts with your immediate product goals, ensuring you're always asking the right questions with the right tools.
Combining Methods for Deeper Product Insights
Why settle for half the story? The most powerful product decisions don't come from choosing between qualitative and quantitative research—they come from blending them. A mixed-methods approach is how you move past isolated data points to build a full, three-dimensional picture of your users.
This synergy creates a powerful feedback loop. You can start with one type of data to spot a problem, then switch to the other to understand and solve it. It’s a cycle of discovery and validation that builds real confidence in your product roadmap.
The Quant-to-Qual Model
One of the most common and effective mixed-methods flows starts with quantitative data to see what is happening, then follows up with qualitative research to figure out why. This is the perfect model for diagnosing problems you can see in your metrics but can't yet explain.
Picture this classic scenario for a product team:
Quantitative Signal: You log into your analytics dashboard and see a massive 45% drop-off rate on your new pricing page. You know you have a problem, but the numbers don't tell you why. Is the layout confusing? Is the value proposition weak? Are the prices just too high?
Qualitative Investigation: You quickly schedule five user interviews. In these sessions, you ask people to walk through the pricing page while thinking aloud. It doesn't take long to spot a pattern: four of the five users said the feature comparison table was overwhelming, leaving them unable to decide which plan was right for them.
This quant-to-qual sequence turns a mysterious metric into a crystal-clear, actionable insight. The numbers pointed you to the fire; the conversations told you exactly what was burning. Combining these insights is essential, as this practical guide to measuring user satisfaction explains, highlighting how hard numbers become truly powerful when paired with human understanding.
The Qual-to-Quant Model
You can also flip the script. The qual-to-quant model starts with deep, exploratory insights and then uses numerical data to validate just how widespread or significant those findings are. It's the perfect way to de-risk a new feature idea or grasp the potential impact of a known pain point.
Here’s how that looks in practice:
Start with Qualitative Discovery: Through a handful of in-depth user interviews, you notice a recurring theme. Several customers mention they wish your project management tool had a way to track time spent on individual tasks. It's a compelling idea, but is it a niche request or a widespread need?
Move to Quantitative Validation: To find out, you build a short survey and send it to a large segment of your user base. A key question asks them to rank potential new features, including time tracking. The results roll in, and a staggering 60% of respondents rank time tracking as their most-wanted feature.
Practical Recommendation: After identifying a potential feature in qualitative interviews, create a simple one-question survey or poll for your users. Ask them to vote on which of three potential new features they'd find most valuable. This is a lightweight way to get quantitative validation without a massive research project. You can also use a tool like Uxia to test a prototype of the new feature and measure task success rates, providing another layer of quantitative evidence.
Supercharging the Feedback Loop with Uxia
This integrated approach is powerful, but it can be slow. Traditional quantitative validation often means designing surveys, finding participants, and waiting days for responses—all of which can kill momentum. This is where a platform like Uxia becomes a game-changer for product teams.
Let's revisit the quant-to-qual example. Your analytics flagged the pricing page drop-off. Before scheduling a single human interview, you could run an instant test on Uxia with AI-powered synthetic users. Within minutes, you’d get quantitative data—like task success rates and heatmaps—alongside qualitative "think-aloud" feedback pinpointing the confusing comparison table.
This lets your team move directly from a quantitative signal (analytics) to a combined quant/qual validation (Uxia), and then to targeted human interviews for deeper emotional context. Uxia handles the initial validation work, letting you confirm hypotheses and identify friction points at speed. It creates a much more agile feedback loop, bridging the gap between insight and action. Combining this with a deep understanding of the voice of the customer helps teams build with confidence.
Bridging the Gap With AI-Powered Research
User research has always come with a frustrating trade-off. You're forced to pick a side: do you want the rich, contextual stories from qualitative research, or the scalable, statistically sound data from quantitative? One gives you depth but takes forever, while the other gives you scale but often misses the crucial "why."
This is exactly where modern AI-powered tools are changing the game. Platforms like Uxia are built to bridge this divide, delivering a potent blend of both research worlds in a single, lightning-fast test. It finally moves teams away from the old 'either/or' dilemma and into a more integrated reality.
The magic is in the use of synthetic users. These AI-driven participants can navigate your designs or prototypes, producing a unique mix of outputs that capture the best of both qualitative and quantitative research.
Getting the What and the Why, Instantly
Instead of juggling separate studies, Uxia gives you one unified report. You get the hard quantitative data points you need for validation, like:
Task Success Rates: A clear number showing how many synthetic users actually completed a mission.
Time on Task: The average time it took to finish a flow, immediately flagging friction points or efficiency gains.
Usability Scores: Standardised metrics that benchmark your design’s ease of use.
But at the same time, you get rich qualitative feedback. Uxia’s synthetic users generate detailed ‘think-aloud’ protocols, narrating their thought processes, moments of confusion, and expectations as they move through your interface. This gives you direct access to the "why" behind the numbers.
Here’s a look at how Uxia presents these blended insights, pairing metrics with direct observations.

This dashboard immediately surfaces critical issues by connecting a metric like 'Task Completion' with direct, actionable quotes from the AI’s feedback. You see exactly where and why users got stuck.
Solving Chronic Research Pain Points
Let’s be honest, one of the biggest headaches in traditional research is logistics. Recruiting participants is slow and expensive, especially for quantitative studies needing large samples. This process can easily add weeks to a project timeline, killing momentum for any agile team.
Practical Recommendation: Use Uxia to run rapid validation tests between sprints. When your team pushes a design change, you can get quantitative and qualitative feedback in minutes, not weeks. This lets you iterate with confidence without ever disrupting your workflow.
Uxia completely eliminates these bottlenecks. It solves the chronic pain points of research by delivering:
Scalability on Demand: Get feedback from dozens or even hundreds of synthetic users instantly. This solves the small sample size problem that so often undermines qualitative work.
Unbiased Feedback: You can avoid the risk of using professional testers or participants who are a little too familiar with usability studies. If you want to dive deeper, you can learn about the key differences between synthetic users vs human users in our detailed article.
Cost-Effectiveness: Drastically slash the budget you’d normally sink into recruitment, incentives, and moderation. Those resources can now go toward other critical activities.
Integrating AI Into Your Research Workflow
Bringing a tool like Uxia into your process doesn’t mean you stop talking to humans. Not at all. It just makes your existing research more efficient and impactful. Think of it as a powerful first step that elevates your entire strategy.
A killer workflow is to use Uxia to get a strong quantitative baseline before you run in-depth qualitative interviews with real people. By running a synthetic test first, you can pinpoint the biggest friction points and form hypotheses backed by actual data.
Practical Recommendation: For your next project, start by running a benchmark test on Uxia with your existing design to get baseline metrics. Then, as you develop new design variations, test them against that benchmark to get immediate, quantitative proof of improvement. This data-driven approach strengthens your design rationale when presenting to stakeholders.
This approach means you walk into your human interviews with a much clearer focus. You already know what the main problems are, so you can spend that precious interview time digging into the emotional and contextual nuances behind them. It makes Uxia an essential tool for any team looking to blend the power of qualitative and quantitative research with the speed modern product development demands.
Common Questions About User Research Methods
When you start blending qualitative and quantitative research, a lot of practical questions pop up. It's easy to get tangled in misconceptions, so let's clear the air. Answering these common questions is key to making smart, confident decisions for your product.
How Many Users Do I Need for Each Research Type?
This is probably the first question everyone asks, and the answer gets right to the heart of what makes these two approaches different. The number of users you need depends entirely on what you’re trying to achieve.
For qualitative research, you're digging for deep insights, not chasing statistical significance. You’re looking for patterns, themes, and those "aha!" moments. Research has shown that with just 5-8 participants from a single user group, you’ll uncover most of the critical usability problems and start hearing the same feedback over and over.
Quantitative research, on the other hand, is all about the numbers. It needs enough data to be statistically sound. The right sample size depends on things like your total user population and how confident you need to be in the results, often requiring hundreds—or even thousands—of participants to deliver reliable, generalisable findings.
Practical Recommendation: The sample size problem for quantitative data is a major bottleneck. A platform like Uxia solves this instantly by giving you a large pool of synthetic testers. You get robust numerical data without the logistical nightmare of recruiting hundreds of people.
Can I Make Quantitative Claims From Qualitative Data?
This is a classic mistake, and it's a dangerous one. It's so tempting to take those rich, compelling observations from a few user interviews and turn them into a snappy percentage. Don't do it. It’s misleading and completely undermines the credibility of your research.
Never, ever report findings from a tiny qualitative sample as a broad statistic. If four out of five users in your study struggled with a new feature, claiming that "80% of users were confused" is just plain wrong. Your sample is far too small to represent your entire user base.
Instead, frame the findings for what they are: powerful, directional insights. A more honest and accurate way to say it would be, "We saw a clear pattern of confusion around the navigation during our user interviews." This points you in the right direction without making false claims.
Practical Recommendation: Use your qualitative findings to build a strong hypothesis. From there, use quantitative methods or a tool like Uxia to validate just how widespread those issues really are.
Which Method Is Better for an Agile Team?
Both are absolutely essential for agile teams, but they play different roles in fast-paced sprint cycles. The trick is to use them together, iteratively, to keep the momentum going.
Agile teams live and die by rapid feedback loops. They often rely on small, quick qualitative tests—like usability testing a prototype—within a sprint. This lets them spot and fix problems fast, before they get baked into the codebase, keeping development moving forward with user-centred fixes.
As a product grows, quantitative data becomes critical for prioritising what to build next and measuring the real-world impact of features you've already shipped. This data helps shape the backlog and set the strategy for future sprints.
Practical Recommendation: Uxia was built for agile workflows. It gives you quantitative-level data with the speed of a qualitative study. Your team can validate decisions with solid metrics in minutes, not weeks, which fits perfectly into a tight development cycle.
How Can We Start Using a Mixed-Methods Approach?
Getting started with a mixed-methods approach doesn't have to be a huge, complicated process. The easiest way in is to set up a simple, repeatable cycle that plays to the strengths of both qualitative and quantitative research.
Find the "What" Quantitatively: Start by looking at your analytics, running a survey, or checking your metrics to find a problem. For example, your data might show a massive drop-off on a key landing page.
Explore the "Why" Qualitatively: Once you know what the problem is, run a small round of qualitative interviews to understand the human behaviour behind the numbers. Why are people leaving that page? What's frustrating them?
Implement and Validate: Use those qualitative insights to drive a redesign. Then, before you ship it, run the new design through a validation tool to get quick quantitative feedback on whether your changes actually fixed the problem.
Practical Recommendation: Uxia is perfect for that final validation step. It delivers quick, reliable data on whether your redesign solved the initial problem, creating a tight, data-informed workflow that closes the loop between insight, action, and validation.
Ready to bridge the gap between qualitative insights and quantitative data? With Uxia, you can get the 'what' and the 'why' in minutes, not weeks. Start testing with AI-powered synthetic users today and build products your users will love.