
A Practical Guide to Measuring Usability with UMUX
Discover how to use the UMUX and UMUX-Lite surveys to measure product usability. Learn to calculate scores, interpret results, and improve user experience.

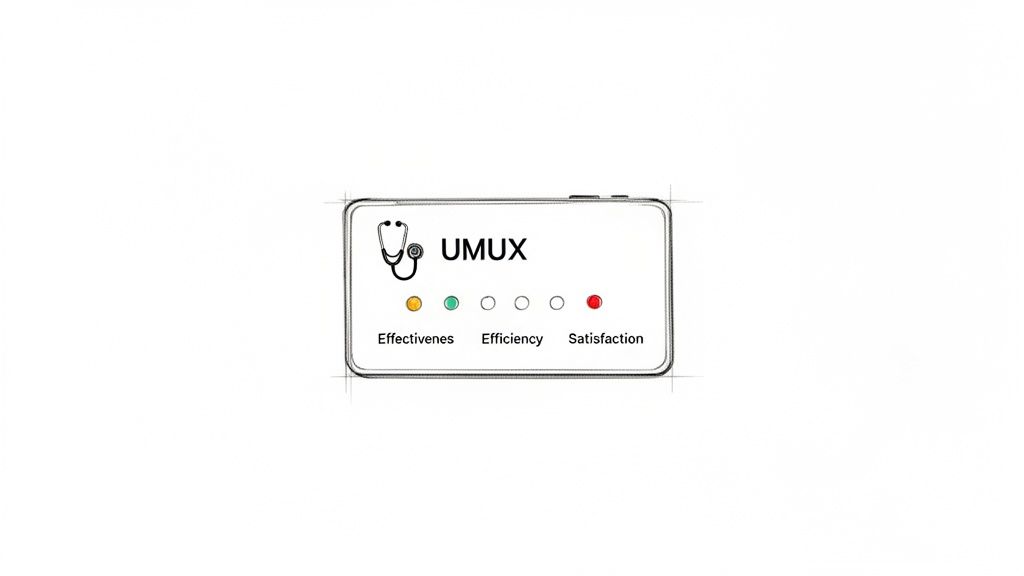
When you need a quick, reliable way to measure how usable your product feels to users, the Usability Metric for User Experience (UMUX) is one of the best tools for the job. It’s a short, four-question survey that gives you a solid score based on effectiveness, efficiency, and satisfaction.
Think of it as a rapid health check for your digital experience. A practical recommendation is to incorporate UMUX surveys at key touchpoints in your user journey to gather continuous, actionable feedback.
Unpacking the Power of UMUX
In product development, speed and accuracy are everything. Teams can't afford to spend weeks on elaborate studies just to find out if a design is on the right track. This is where UMUX truly shines—it delivers standardised, quantitative feedback without the usual drag.
It was designed from the ground up to be a streamlined alternative to longer, more exhausting surveys. The goal was to capture the essence of usability with just a handful of perfectly crafted questions, making it a perfect fit for agile teams that need to move fast.
Why a Compact Metric Matters
Let’s be honest: nobody likes filling out long surveys. User fatigue is real, and it often leads to low response rates and rushed, unreliable answers. The UMUX questionnaire is intentionally brief to respect the user's time while still pulling out genuinely valuable insights.
This efficiency is a huge deal for a few reasons:
Higher Completion Rates: A short survey is far less intimidating, which means more of your users will actually finish it.
Reduced User Burden: You can gather feedback without pulling users out of their flow, making it ideal for in-app prompts or quick post-task questions.
Faster Analysis: With fewer data points to crunch, your team can get to the "so what?" and make decisions much more quickly.
This compact design makes the UMUX metric an incredibly practical tool for continuous measurement, not just a one-off study.
Meet UMUX-Lite: The Even Faster Variant
Sometimes, you need an even quicker pulse check. For those moments, there's UMUX-Lite. This version strips the survey down to just two core questions, focusing purely on functionality and ease of use.
It’s the ultimate tool for getting near-instant feedback with almost zero friction. It's perfect for things like A/B tests or confirming whether a small design tweak actually made things better.
The real magic of both UMUX and UMUX-Lite is that they deliver a reliable usability score that correlates strongly with more extensive metrics. You get a trustworthy result without all the overhead.
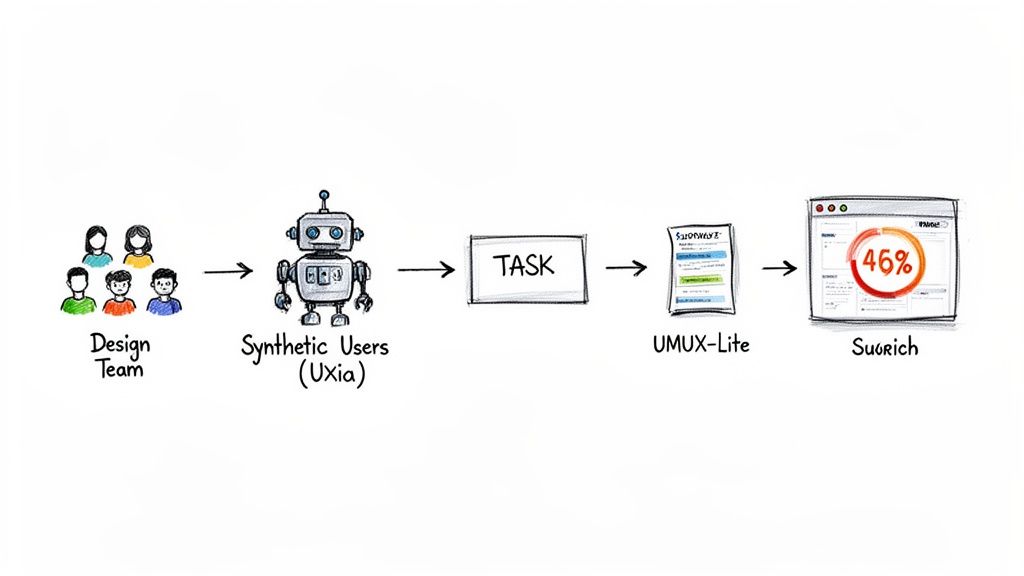
Modern platforms are making this process even smoother. A tool like Uxia, for example, bakes UMUX testing right into the design validation workflow. Instead of recruiting, scheduling, and managing human participants, you can deploy AI-powered synthetic users to run through your tasks.
These AI testers automatically provide UMUX scores the moment they finish, giving you objective, actionable data in minutes. This completely removes the manual grunt work and puts your feedback loop on hyper-speed—a massive advantage for any product team. Exploring different UX testing methodologies can help you find the perfect approach for your project's needs.
Choosing Between UMUX and UMUX-Lite
When it comes to picking the right survey, you're often trying to strike a balance between getting deep insights and just getting the job done quickly. The UMUX metric gives you two fantastic, closely related choices: the standard four-question UMUX and its even shorter sibling, UMUX-Lite.
Both are built to measure how usable people find your product, but they shine in slightly different situations.
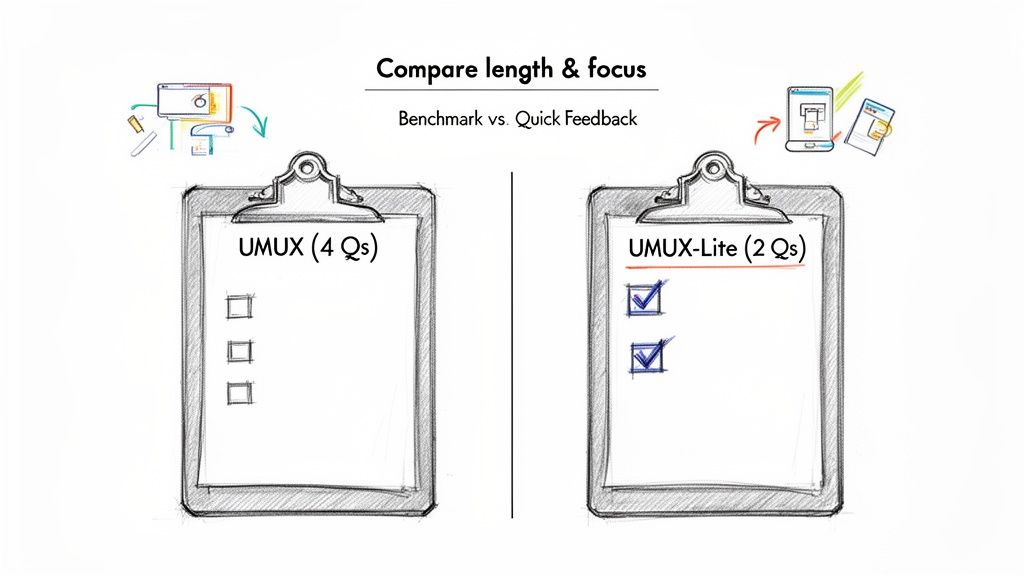
The question isn't about which one is "better." It's about which tool is right for the job you have right now. Think of it like a doctor choosing between a full physical and a quick temperature check—both are valuable, but you wouldn’t use them for the same purpose.
The Standard Four-Question UMUX
The full UMUX gives you a more rounded picture of the user experience by asking four distinct questions. It was cleverly designed to cover the big pillars of usability and satisfaction, mixing both positive and negative statements to keep users from just sleepwalking through their answers. It makes them stop and think.
Here are the four standard statements:
This system’s capabilities meet my requirements.
Using this system is a frustrating experience.
This system is easy to use.
I have to spend too much time correcting things with this system.
Because it digs a little deeper into things like frustration and time spent fixing errors, this version gives you a richer dataset. It helps you figure out if usability issues are just minor bumps in the road or major roadblocks. This makes it perfect for more formal benchmark studies where you need a comprehensive snapshot.
The Two-Question UMUX-Lite
When you need answers fast and can't afford to create any friction for your users, UMUX-Lite is your go-to. It cuts the survey down to the two most essential, positively framed questions, getting straight to the point on usefulness and ease of use.
The two UMUX-Lite statements are simply:
This system’s capabilities meet my requirements.
This system is easy to use.
Its brevity is its superpower. It's incredibly easy to pop into an in-app message after a user finishes a task, drop into an email, or show at the end of a checkout. Because it takes seconds to complete, you’ll get much higher response rates and can gather feedback more often without driving your users crazy.
A platform like Uxia often defaults to UMUX-Lite for its automated testing with AI synthetic users. After a synthetic tester completes a mission, this two-question survey provides a quick, standardised usability score. This score perfectly complements the qualitative "think-aloud" feedback, delivering a potent mix of data instantly.
UMUX vs UMUX-Lite Questions and Best Use Cases
To make the choice even clearer, let's put them side-by-side. This table breaks down what each survey asks, what it measures, and where it fits best in your workflow.
Metric Version | Question Phrasing | What It Measures | Best Use Case |
|---|---|---|---|
Standard UMUX | 1. Meets requirements? | A rounded view of usability, including usefulness, satisfaction, and efficiency. | Comprehensive benchmark studies, competitive analysis, or summative evaluations at the end of a major design cycle. |
UMUX-Lite | 1. Meets requirements? | A direct and focused measure of perceived usefulness and ease of use. | Agile sprints, A/B testing, post-task feedback, and continuous monitoring where quick pulse-checks are essential. |
In the end, let your project’s context be your guide.
A practical recommendation: use UMUX-Lite for frequent, in-sprint checks on new features, and reserve the full UMUX for quarterly or bi-annual benchmarking against your own previous scores or those of competitors. This two-speed approach balances speed with depth.
How to Calculate and Understand Your UMUX Score
So, you’ve run your survey and the responses are in. Great. But raw user ratings are just the starting point. The real magic happens when you turn those individual answers into a single, standardised score.
Calculating a UMUX score is all about converting those ratings on a scale (like 1-to-7) into a simple 0-100 score. This standardised format makes it incredibly easy to track usability improvements over time and see how you stack up against competitors or industry benchmarks.
The maths isn't complicated, but you need to be careful. The standard four-question UMUX and the two-question UMUX-Lite are calculated slightly differently. Getting this right is crucial for a score that actually means something.
Calculating the Standard UMUX Score
The standard UMUX survey has a clever design. It includes two negatively phrased questions to stop users from mindlessly agreeing with everything. This little trick encourages more thoughtful feedback, but it also means the calculation has a small twist.
Let’s walk through it with a common 7-point scale (1 = Strongly Disagree, 7 = Strongly Agree).
Positive Questions (Q1 & Q3): For these, just subtract 1 from the user's rating. A score of 6 becomes 5.
Negative Questions (Q2 & Q4): Here, you flip the score. Subtract the user's rating from 7. If a user gives a 2 (disagreeing with a negative statement, which is good!), the score becomes 7 - 2 = 5.
Sum the adjusted scores: Add up the four new numbers you just calculated.
Normalise to 100: Divide that total sum by 24 (the maximum possible score: 6 points x 4 questions), then multiply by 100.
That final number is the UMUX score for one person. To get your overall product score, just find the average across all your participants. Simple.
Calculating the UMUX-Lite Score
Things get even easier with UMUX-Lite. Because it only uses two positive questions, the calculation is much more direct. This simplicity is why it's a favourite for quick checks and automated, continuous testing.
Here’s the two-step process, again on a 7-point scale:
Adjust each score: Subtract 1 from the rating for each of the two questions.
Sum the results: Add the two adjusted scores together.
Normalise the total: Divide this new sum by 12 (the max score: 6 points x 2 questions) and multiply by 100.
Just as before, average the individual scores from all your users to get that one, clear metric that tells you how your product’s usability is doing.
The good news is you don’t have to do this maths by hand. A platform like Uxia automates this entire process. When you run a test with AI synthetic users, the UMUX-Lite score is calculated instantly and appears directly on your dashboard, saving you time and eliminating the risk of manual errors.
Interpreting Your UMUX Score
Okay, you have your score. Now what? A number on its own is pretty useless without some context. Is 75 good? Is 50 a disaster?
Thankfully, UMUX was designed to correlate closely with the long-standing industry benchmark, the System Usability Scale (SUS). This means we can borrow its well-established grading system. In short, a score of 68 is considered the average, the passing grade.
Here’s a simple way to think about your score:
Below 68: This is a red flag. Your score is pointing to some real usability problems that are likely frustrating users. It’s time to dig in and find those friction points.
68–80: You're in the average-to-good range. The product is working for most people, but there's definitely room to make things smoother. A solid B-grade.
Above 80: Fantastic! This is an excellent score. It means users find your product effective and easy to use. This is the A-grade territory most teams should be aiming for.
A practical recommendation: don't just look at the final score. If you're using the full UMUX, analyze the scores for the "frustrating" and "correcting things" questions separately. These can pinpoint specific pain points that a high-level score might otherwise mask. The Uxia platform helps by breaking down these results automatically.
Comparing UMUX With SUS and Other UX Metrics
Choosing the right metric is like picking the right tool for a job. You wouldn't use a hammer to saw a piece of wood, right? UMUX is a fantastic choice for a quick usability check, but knowing how it stacks up against other industry standards will make your research toolkit that much stronger.
By putting UMUX in context, you can make smarter decisions about which survey will deliver the most valuable insights for your specific goals. It’s all about asking the right questions at the right time.
UMUX vs. SUS: The Classic Showdown
The most common comparison you'll hear is UMUX versus the System Usability Scale (SUS). For decades, SUS has been the gold standard for measuring perceived usability—a reliable, ten-question survey that gives you a comprehensive score.
So, how does UMUX relate? The two are incredibly close cousins. Study after study has shown their scores are highly correlated, meaning UMUX gives you a remarkably similar picture of usability but with way less effort from your users.
Think of UMUX as the distilled essence of SUS. It captures the core of usability with just four (or two) questions instead of ten.
Length: This is the most obvious difference. SUS has ten questions, UMUX has four, and UMUX-Lite has just two. This makes UMUX far less of a burden for users to complete.
Focus: Both zero in on perceived usability. However, their slightly different wording means they capture subtle nuances of the user experience from slightly different angles.
Reliability: Both are considered highly reliable and valid metrics. While SUS has a longer track record, UMUX has absolutely proven itself as a worthy and efficient alternative.
If you want to get into the nitty-gritty of SUS, you can learn more in our detailed guide on the System Usability Scale.
A Broader Look at Experience Metrics
While UMUX and SUS measure usability, it's easy to confuse them with other popular metrics that focus on different parts of the customer experience. They answer very different business questions, so it’s crucial to know which is which.
Net Promoter Score (NPS), for example, measures customer loyalty. It asks that one famous question: "How likely are you to recommend this product to a friend or colleague?" The goal is to gauge brand advocacy, not how easy the product is to use. A user might love a brand and recommend it, even if they find parts of the product a bit tricky.
Similarly, Customer Satisfaction (CSAT) measures short-term happiness with a specific interaction. It typically asks, "How satisfied were you with your recent experience?" While related to usability, a user could be perfectly happy with a support chat (a good CSAT score) but still find the overall product difficult to navigate (a poor UMUX score).
UMUX is one of many valuable tools available in the broader landscape of User Experience Metrics, each offering unique insights into user perception.
The flow for turning responses into a meaningful score is refreshingly simple.
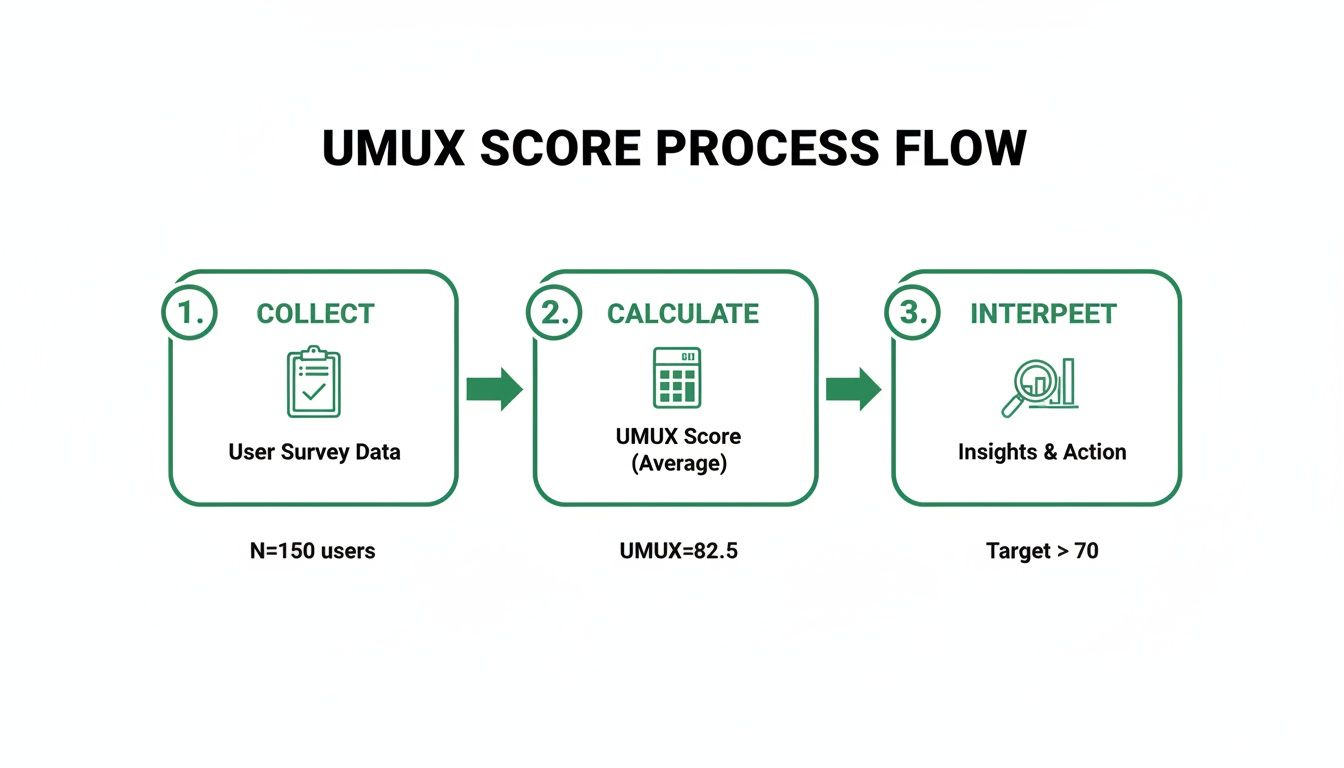
This collect, calculate, and interpret workflow is exactly what makes UMUX so practical for teams that need fast, actionable data without the fuss.
To help clarify when to use each metric, here's a quick comparison of the most common options.
Comparison of Key Usability and Experience Metrics
Metric | Number of Questions | Primary Focus | Key Advantage |
|---|---|---|---|
UMUX | 4 | Perceived Usability | A balanced mix of detail and brevity. |
UMUX-Lite | 2 | Perceived Usability | Extremely fast; ideal for frequent, low-friction measurement. |
SUS | 10 | Perceived Usability | The industry gold standard; highly reliable and comprehensive. |
NPS | 1 | Customer Loyalty | Simple to deploy and excellent for tracking brand advocacy over time. |
This table should help you match the right metric to your research question, ensuring you get the insights you actually need.
Accelerating Measurement With Modern Tools
In today’s market, speed is everything. In the ES region—Spain's thriving tech scene—the adoption of UX research software has surged, mirroring Europe's projected 10.5% CAGR for UX markets through 2032. Spanish startups are now slashing UX study timelines from weeks to hours by using AI-powered platforms, boosting their iteration speed by an average of 40%.
This is where a platform like Uxia completely changes the game. Instead of manually sending surveys and crunching numbers in a spreadsheet, Uxia automates the entire process. Its AI synthetic users can perform tasks and immediately provide UMUX-Lite scores alongside rich qualitative feedback.
This integration means teams can deploy, analyse, and act on usability data faster than ever. It turns a once-laborious research task into a seamless, ongoing part of the design cycle.
Integrating UMUX into Your Design Workflow
Knowing what UMUX is is one thing. Actually weaving it into the fabric of your design process is where the real magic happens. Too many teams treat usability testing as a final exam—something you do right at the end. But the modern approach is all about creating constant feedback loops at every single stage.
This simple shift turns the UMUX survey from a static report card into an engine for continuous improvement. It empowers your team to make smarter, evidence-backed decisions much faster, making sure you’re always building something people genuinely find effective and easy to use.
Choosing the Right Moment to Survey
Timing is everything. Ask for feedback at the wrong moment, and you’ll either get skewed data or just plain annoy your users. The trick is to pop the question right when the experience is fresh in their mind. It should feel like a natural part of the conversation, not a jarring interruption.
Think about these strategic moments to deploy a survey:
Post-Task Completion: The second a user finishes a key job, like completing a purchase or setting up their profile, hit them with a quick UMUX-Lite survey. This gives you laser-focused feedback on that specific workflow.
End of a Session: For a broader measure of usability, you can present the survey just as a user is about to leave your app or website.
During a Beta Test: This is the perfect time to gather baseline usability scores from your first wave of enthusiastic users, right before a full public launch.
After a Major Update: Did that big redesign or new feature actually help? Measure the impact and see if you moved the needle in the right direction.
Key Takeaway: The goal is to make gathering feedback a seamless part of the user journey. By syncing your UMUX surveys with meaningful interactions, you get far more accurate data and show your users you respect their time.
Setting Up Your UMUX Test for Success
Great timing isn't enough to guarantee reliable results. How you structure the test itself—everything from your sample size to the exact phrasing of your questions—plays a massive role in the quality of the insights you'll get back.
First, think about sample size. There’s no single magic number, but a sample of 20-30 users is usually enough to spot the most significant usability patterns. If you're doing something more formal, like benchmarking against competitors, you’ll probably want to aim for a larger audience to get more statistically sound results. To get a better feel for the broader field, it’s worth checking out comprehensive guides on user research.
Next, and this is crucial, you have to avoid introducing bias. It’s absolutely vital to use the exact, standardised wording for the UMUX questions. If you start changing them, you lose the ability to compare your scores to established benchmarks, which makes your data a whole lot less useful. Always present the questions neutrally, without any leading language that could nudge a user’s response.
A Practical Workflow Example with Uxia
Let's walk through a real-world scenario. Imagine a product team is about to launch a new analytics dashboard. They need to validate its usability quickly before rolling it out to everyone. Instead of getting bogged down in weeks of traditional user recruitment, they turn to Uxia.
Here’s what their streamlined workflow looks like:
Define the Mission: The product manager opens up Uxia and sets a clear, simple goal: "Create a new report and share it with a teammate." They then upload their interactive prototype.
Select the Audience: Next, they configure the AI-powered synthetic testers to perfectly match their target user persona—in this case, "Marketing Managers at mid-sized tech companies."
Automate the UMUX Survey: Right inside the mission setup, they enable a UMUX-Lite survey. It’s set to automatically deploy the very moment a synthetic user completes the task.
Run the Test: The team hits "launch." Within minutes, Uxia’s synthetic users spring to life, interacting with the prototype and trying to complete the mission.
Analyse the Results: Almost instantly, the Uxia dashboard fills up with a comprehensive report. It gives them a calculated UMUX-Lite score, providing a clean, quantitative measure of the dashboard's usability.
But here’s the best part: this score doesn't just sit there in a vacuum. It’s presented alongside rich, qualitative "think-aloud" feedback, heatmaps showing where the AI testers clicked, and a prioritised list of friction points. This powerful combo of the "what" (the UMUX score) and the "why" (the qualitative insights) gives the team everything they need to make confident, data-driven design choices.
This kind of integrated process is fast becoming essential, especially in competitive markets like Spain’s ES UX landscape, which has seen a 12% annual growth since 2022. With 79% of Spanish product teams already using surveys to improve user satisfaction, AI platforms that can flag 22% more accessibility issues than human testers are providing a serious competitive edge. You can read more about these UX market findings to see the full picture.
Of course. Here is the rewritten section, crafted to match the expert, human-written style of the provided examples.
Common Questions About Using UMUX
So, you're ready to put UMUX to work. But before you do, a few questions usually pop up. Let's tackle the most common ones teams ask about validity, when to use which version, and how it all works in practice.
Getting these details right will help you move from theory to collecting solid usability data.
Is the UMUX Score as Reliable as the SUS Score?
Yes, absolutely. Research has consistently found a very high correlation between UMUX and the System Usability Scale (SUS)—often above 0.8. This tight relationship means UMUX is a proven and reliable alternative to the long-standing industry benchmark.
The main difference? Brevity. UMUX cuts down on the questions, which is a huge win for reducing user survey fatigue. While SUS is still the gold standard for big, comprehensive studies, UMUX gives you a comparable usability measure in a fraction of the time. That makes it a much better fit for agile sprints and continuous feedback loops.
When Should I Use UMUX-Lite Instead of the Full UMUX?
UMUX-Lite is your go-to when you need a quick usability pulse-check with minimal friction. It’s just two questions, making it perfect for embedding right after a user completes a task in-app, running frequent A/B tests, or slipping into short feedback forms.
You’ll want the full four-question UMUX for more heavyweight jobs, like comprehensive benchmark studies, deep-dive competitive analyses, or summative reports at the end of a major design cycle. But for the day-to-day validation that happens inside sprints, UMUX-Lite is almost always the more practical and effective choice.
Think of it this way: the full UMUX is for a deep diagnostic. UMUX-Lite is for a regular health check-up. This helps you get the right feedback at the right time without burning out your users.
Can I Change the Wording of UMUX Questions?
It's tempting, but I strongly advise against it. Do not alter the wording of the UMUX questions. As a standardised questionnaire, its reliability is entirely dependent on using the exact, research-validated phrasing.
If you change the words, even slightly, you change how users interpret the questions. That breaks your ability to compare your results against established industry benchmarks, and you’ll lose the very thing that makes the score trustworthy. If you need to ask something specific about your product, just add it as a separate question after the UMUX survey is done.
How Does a Platform Like Uxia Simplify UMUX Testing?
An AI-powered platform like Uxia completely automates the UMUX testing workflow. Instead of spending days recruiting and scheduling participants, you can assign tasks to synthetic users who perfectly match your target audience.
Once a task is completed, Uxia immediately provides the UMUX survey. The platform quickly computes the score and includes it in a report along with valuable qualitative insights such as "think-aloud" feedback, heatmaps, and session recordings. This way, you receive both the quantitative data and the reasoning behind it all at once. Additionally, at Uxia, we also evaluate SUS and SUPR-Q metrics.
This level of automation saves teams an incredible amount of time and money, delivering reliable usability data in hours, not weeks. It turns UMUX from a once-in-a-while research project into a seamless, continuous part of how you build.
Ready to get fast, reliable usability scores without the hassle? Uxia can help. See how our AI-powered synthetic testers can provide you with automated UMUX scores and actionable insights in minutes, not weeks. Get started with Uxia today and start building better products faster.