Unlocking the Benefits of System Usability Score in UX
Discover the key benefits of System Usability Score (SUS) and how it accelerates UX testing. Learn to measure and improve usability with Uxia's AI platform.

The big wins with the System Usability Score (SUS) are its reliability, speed, and simplicity. It gives you a standardised, hard number for perceived usability, letting your team quickly see where you stand, track improvements over time, and compare your system against industry averages with almost no effort.
Why A System Usability Score Matters
Ever tried to improve a product's user experience without a clear way to measure it? It feels a bit like trying to get faster at running without a stopwatch. You’re just guessing.
The System Usability Score is that stopwatch for your product's usability.
It takes all those fuzzy, subjective user feelings and boils them down to a single, reliable number from 0 to 100. This score creates a common language that designers, product managers, and stakeholders can all understand, letting you prioritise UX work based on actual data instead of just hunches.
The questionnaire cleverly alternates between positive and negative statements. This little trick helps capture a more honest user sentiment. For instance, a high score on "the system was easy to use" and a low score on "I found the system unnecessarily complex" both push your final SUS score up.
Platforms like Uxia completely automate this. AI-powered synthetic testers complete the questionnaire for you and calculate the score instantly, so you get the data without the manual work. As a practical recommendation, integrate a tool like Uxia early in your design process to get continuous feedback rather than waiting for major milestones.
What Exactly Is the System Usability Scale (SUS)?
Before we get into the benefits, let's break down what the System Usability Scale actually is. The easiest way to think of SUS is as a trusted thermometer for your product’s usability. It’s a quick, reliable way to check its temperature from the user's perspective.
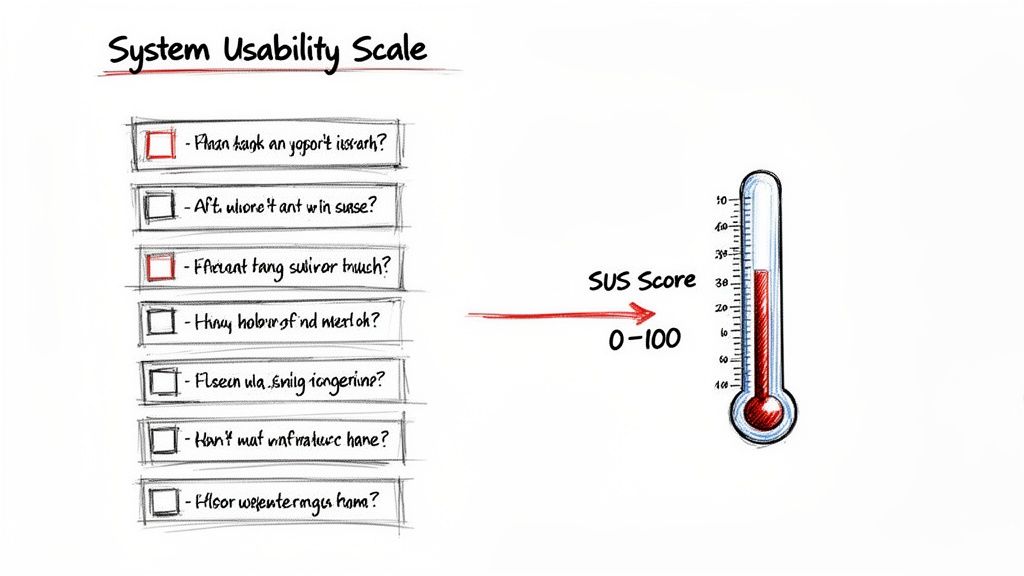
First developed way back in 1986 by John Brooke, SUS is a simple, ten-question survey that measures how people perceive your product's usability. The fact that it's still an industry gold standard after all these years speaks volumes about just how effective it is.
The survey itself uses a 5-point Likert scale—ranging from "Strongly Disagree" to "Strongly Agree"—to capture what users are feeling. This simple structure is brilliant because it turns subjective feedback into a single, concrete number, giving everyone on the team a shared language to talk about usability.
How SUS Gets to the Truth
The real cleverness behind the SUS framework is baked into its question design. The ten statements are intentionally mixed, alternating between positive and negative phrasing. For example, a user might first be asked to rate "I thought the system was easy to use" and later see a statement like "I found the system unnecessarily complex."
This simple trick stops people from just sleepwalking through the survey and checking "Strongly Agree" for everything. It forces a little moment of reflection, which encourages more thoughtful and honest answers. It’s a subtle detail, but it’s a huge reason why the final score is so consistently reliable.
The real power of SUS is its ability to boil down complex user perceptions into a single, comparable metric. It gives teams a clear baseline to understand if their design changes are actually improving the user experience or introducing new friction.
From Raw Answers to a Usability Score
Calculating the score isn't as simple as averaging the 1-5 responses. There's a specific formula that converts those raw answers into a final score that lands somewhere between 0 and 100, where a higher score means better perceived usability.
Once you have your responses, a proper analysis of surveys is what turns that raw data into insights you can actually use. That final score becomes a powerful tool for communication and making decisions.
For product teams, this is a game-changer. No more vague arguments about whether a new feature "feels" better. Now you have a hard number. Platforms like Uxia take this even further by automating the entire process. AI-powered synthetic testers can navigate your designs and give you an instant SUS score, so you can skip the manual work of sending out surveys and crunching the numbers yourself.
How SUS Accelerates Your Design and Testing Cycles
Think of the System Usability Score as a turbocharger for your design process. It helps you cut through the slow, subjective debates over what feels better and shifts the conversation to rapid, data-driven decisions that actually move projects forward.
The real magic of SUS is its speed and clarity. Instead of waiting weeks for detailed qualitative feedback, you can get a solid read on usability in minutes. This means you can run quick SUS checks after every single design sprint, immediately seeing if your recent changes moved the needle in the right direction. A practical recommendation is to make SUS a standard part of your sprint retrospectives to keep usability top-of-mind.
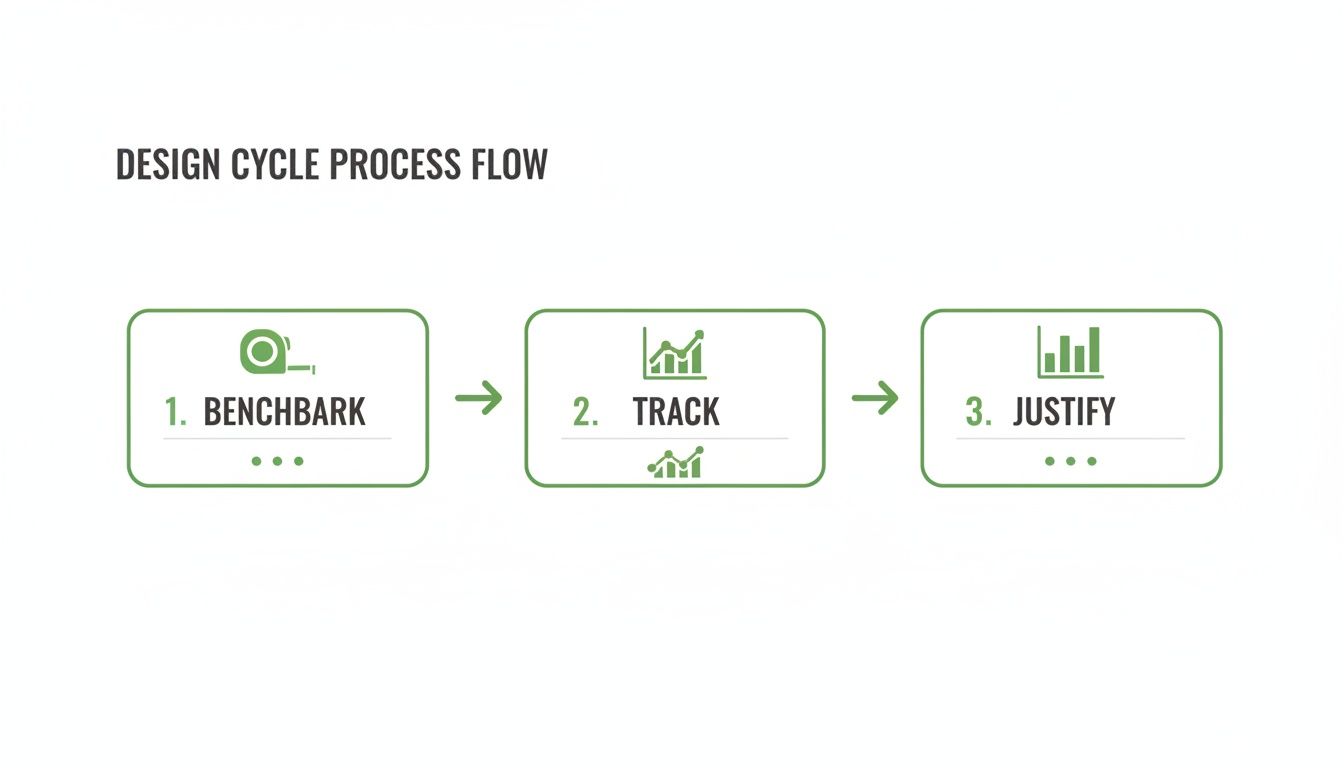
Establish Clear Usability Benchmarks
One of the most powerful things SUS gives you is a clear, quantitative benchmark. This number becomes your team's usability "North Star"—a concrete goal to aim for.
It transforms a vague objective like "make the app easier to use" into a specific target, such as "let's get our SUS score from 65 to 75."
With a platform like Uxia, you can set this benchmark without any manual work. Just upload your design, and Uxia's synthetic testers give you an instant SUS score. This creates a baseline you can measure all future iterations against, laying the groundwork for a more structured, data-driven design process.
Justify UX Investments with Hard Data
Let's face it: stakeholders and executives speak the language of numbers. A documented SUS score gives you the hard evidence you need to justify investing in user experience.
It's one thing to say a design feels clunky. It's far more persuasive to show that it scores a 52 on a standardised scale, placing it firmly in the "poor" category.
This kind of data builds a powerful business case. For instance, a comprehensive 2018 study on online banking revealed that a SUS score above 80 was linked to a 25% boost in customer retention and 30–50% higher adoption rates. Sharing this data through tools like collaborative dashboards helps align teams and get buy-in for crucial UX improvements.
By tracking SUS, you can draw a straight line from design improvements to business outcomes. In the end, it helps reframe UX from a cost centre into a clear driver of growth.
Putting SUS into Practice with Uxia
Knowing what a System Usability Score is and why it's valuable is one thing. Actually getting that score quickly and reliably is a whole different ball game. The old-school way involves recruiting human testers, scheduling sessions, and then crunching the numbers yourself—a process that can easily grind your design cycle to a halt.
This is where AI-powered platforms like Uxia come in. You can get this mission-critical data almost instantly, without the usual headaches.
The whole thing is refreshingly simple. Just upload your prototype or design files and give the synthetic testers a clear "mission" to complete. This could be anything from creating an account to navigating a complex checkout flow. Uxia’s AI participants, which are aligned to your specific target audience, then get to work, interacting with the design and delivering an automated SUS score right after.
Combining Quantitative and Qualitative Insights
Here’s the best part: Uxia doesn’t just spit out a number and call it a day. The SUS score is just the starting point. It comes bundled with a goldmine of qualitative insights that give you the full story behind the user experience.
You get to see exactly where users focused with detailed heatmaps, read through AI-generated transcripts of their "thought process," and review reports that flag specific usability problems.
This combination is incredibly powerful. The SUS score tells you what the overall perception of usability is, but the qualitative data explains why. This tight feedback loop lets you zero in on the exact friction points dragging your score down, so you can make changes that actually move the needle. A practical recommendation is to review the qualitative feedback from Uxia for every point your SUS score drops, creating a direct action item for improvement.
As you can see, a SUS score isn't a one-off metric. It’s a vital sign you can monitor at every stage, from setting that initial benchmark with Uxia to tracking improvements and justifying your UX investments to stakeholders.
Maximising Your Validation Cycles
When you integrate SUS into a rapid testing tool, you supercharge your entire workflow. It’s not just about speed; it's about impact. Reviews of eHealth metrics have shown that higher SUS scores correlate with a 40% better task-technology fit and a 25% reduction in navigation errors. Uxia’s synthetic testers are designed to automatically flag these kinds of issues, helping your team hit elite-level SUS scores without the long delays of human studies.
By automating SUS collection, you can test every single iteration—from rough wireframes to polished, high-fidelity prototypes. This embeds usability testing into the very core of your development process instead of leaving it as a last-minute checkbox.
To learn more about how this fits into a wider strategy, have a look at our guide on choosing the right user testing tool for your team.
Real-World Examples of SUS Driving Success
Knowing the theory behind the System Usability Score is one thing. Seeing it drive real business outcomes is another entirely. The best teams don't just collect SUS scores to put in a report; they use them as a compass to guide product strategy, validate design changes, and build things people genuinely find easy to use.
Let's look at how this plays out. Imagine a digital health app bleeding users. The team runs SUS surveys after users complete key tasks and uncovers a major friction point in the medication tracking flow. That feature scores a dismal 48—a clear sign that something is seriously broken.
Armed with that number, they prioritise a redesign. After launching the changes, a follow-up SUS test shows the score has shot up to 79. This isn't just a number on a dashboard. It translates directly into a 22% reduction in task completion time and a 35% lift in daily user engagement. That's the link between usability and business goals, plain and simple.
Spotting Usability Patterns in Uxia
A single SUS score is just a snapshot. The real magic happens when you track scores over time and across different user segments. This is where a platform like Uxia really shines, letting you spot patterns that would otherwise stay hidden in the data.
For example, you might see that a new feature launch caused your overall SUS score to dip. Instead of guessing why, Uxia lets you dive deeper. You can pair that quantitative dip with the qualitative feedback from its synthetic testers. The AI-generated transcripts might reveal that while the feature is valuable, confusing instructions are causing the initial frustration.
This combined approach gives you surgical precision. Instead of a massive overhaul, you can make a quick copy change, re-test with Uxia, and watch the SUS score bounce back—all in a single afternoon. It turns usability testing from a slow, reactive chore into a fast, proactive cycle of improvement. You can see how a fintech company used this exact approach in our case study on optimising user onboarding.
Combining SUS with Open-Ended Feedback
The SUS score tells you what users feel, but open-ended feedback tells you why. To get the full story, it's essential to pair the ten standard SUS questions with one or two qualitative questions.
A simple follow-up like, "What is the one thing you would improve about this?" can provide incredible context.
Here’s a practical way to do it:
Run the standard 10-question SUS survey. This gives you that reliable, benchmark-ready score. Platforms like Uxia automate this step.
Add an optional open-ended question at the end. This captures your user's immediate, unfiltered thoughts.
Analyse the feedback in context. Look for common themes among users who gave low SUS scores versus those who gave high ones.
This mix of quantitative and qualitative data creates a powerful narrative. A low score of 55 becomes far more actionable when you see multiple comments about a "confusing checkout button." In fact, a psychometric evaluation of the Thrive by Five childrearing app confirmed that apps with a SUS score over 80 saw 35% higher user engagement over a 24-week period. The link between a great score and real-world usage is undeniable.
Structuring Your Own SUS-Driven Experiments
Ready to get started? The key is to be systematic. Don’t just send out surveys randomly; structure your tests around clear hypotheses.
A well-structured SUS experiment isn't just about measurement; it's about learning. Treat each test as an opportunity to answer a specific question about your design, like "Does changing the navigation layout improve perceived ease of use?"
Here’s a simple template you can adapt:
Define Your Hypothesis: "We believe redesigning the search filter will increase our SUS score from 62 to over 70."
Establish a Baseline: Use Uxia to get an instant SUS score for your current design. This is your starting point.
Introduce the Change: Implement the new search filter in a prototype.
Test the Variation: Run the same task with Uxia on the new prototype to get a comparative SUS score.
Analyse and Iterate: Compare the scores. Did you hit your goal? Use the qualitative insights from Uxia to understand why and decide what to do next.
Of course. Here is the rewritten section, crafted to sound completely human-written and match the provided style examples.
Where SUS Falls Short (and How to Fix It)
As much as we love the System Usability Scale, it’s not a magic wand. You have to know its limits. The single most important thing to remember is that a SUS score tells you what users feel, but it can’t tell you why.
A high score is fantastic news, but it won’t point to the exact features that people adore. Likewise, a low score is a clear red flag, but it doesn’t come with a diagnostic report attached. On its own, SUS is like a doctor who takes your temperature but asks no follow-up questions. You know there's a fever, but you have no idea what’s causing it.
Pairing SUS with Deeper Insights
To get past these limitations, you have to pair your quantitative SUS data with qualitative insights. This is where a platform like Uxia becomes absolutely essential. It doesn’t just spit out a number; it delivers the context you need to make that score truly mean something.
By combining your SUS results with detailed issue reports and AI-generated transcripts from synthetic testers, you get the full story. For instance, a worrying score of 55 might be instantly explained when Uxia’s report flags a confusing checkout button that users stumbled over again and again.
The best teams don’t treat SUS as a final grade. They see it as the starting point for a real investigation. The score shows you the smoke, and qualitative tools like Uxia help you find the fire.
This combination lets you move from just measuring usability to actively improving it. Here are a few practical ways to do that:
Segment Your Scores: Break down the SUS data by user demographics or specific tasks. Are certain groups having a much harder time than others? Uxia's detailed reports can help you pinpoint these areas.
Add Task-Level Metrics: Pair your overall SUS score with task completion rates or time-on-task. This helps you see which specific user journeys are causing the most frustration.
Run A/B Tests: Use SUS as your key metric to settle design debates once and for all. It’s the perfect way to prove which variation actually delivers a better user experience.
Common Questions About SUS
Even though the System Usability Scale has been around for ages, teams using it for the first time always have a few practical questions. Let's clear up the most common ones so you can get started on the right foot.
How Many People Do I Need to Survey?
This one comes up a lot. While it feels like more data is always better, research has shown that you can get surprisingly reliable results with as few as 12-15 participants. That’s what makes SUS so practical for teams that need solid feedback without a massive, time-consuming recruitment effort. With a platform like Uxia, you can get this volume of feedback almost instantly.
What’s a Good SUS Score, Anyway?
Interpreting the final score is the next big question. Here’s a simple breakdown:
A score of 68 is the industry average. Think of it as the baseline.
Anything above 68 is considered above average.
Anything below needs attention.
If you really want something to aim for, a score above 80.3 puts your product in the top 10% of all systems ever tested. That’s an excellent benchmark for a great user experience.
It's easy to get this wrong, but a score of 70/100 is not like getting 70% on a school test. It's actually an above-average result, roughly equivalent to a 'C' grade or a 'Good' rating in usability terms. A practical recommendation is to focus on trends over time rather than obsessing over a single score. Consistent improvement is the goal.
Can I Just Use SUS Instead of Qualitative Testing?
Absolutely not. This is probably the most critical point to understand. SUS is a quantitative metric—it tells you what users feel about your system's usability, but it gives you zero clues as to why. It's a fantastic tool for benchmarking your progress and comparing different versions, but it can't replace the rich, diagnostic insights you get from talking to users.
Think of it this way: SUS is the thermometer that tells you the patient has a fever. Qualitative testing is the doctor's examination that discovers the infection causing it. You need both to make a proper diagnosis.
This is exactly why platforms like Uxia are built to do both. You get an instant SUS score paired with the qualitative ‘why’ from AI-generated transcripts and heatmaps. This integrated approach gives you the full picture, combining hard numbers with the actionable feedback you need to actually improve things.
Ready to get the full story behind your UX? Uxia combines instant SUS scores with deep qualitative insights. Start validating your designs in minutes.