A UX Pro's Guide to Calculating Your SUPR Q Score
Learn how to calculate and improve your SUPR Q score. This guide covers the entire process, from data collection to using AI for predictive UX insights.

The SUPR-Q score is an eight-question survey that measures the quality of a user's website experience. It benchmarks your product against a huge database of over 200 websites to give you a percentile rank covering usability, trust, appearance, and loyalty.
So, What Exactly Is the SUPR-Q Score?
When you’re deep in the weeds of UX, you need a reliable benchmark. That’s where the Standardized User Experience Percentile Rank Questionnaire, or SUPR-Q, comes in. It’s not just another flimsy satisfaction survey; it’s a psychometrically validated tool for putting a real number on the quality of a digital experience.
Think of it like a standardised test for your website or app. It gives you a direct, data-driven way to see how you stack up against everyone else. The score is a percentile, which means if you get a SUPR-Q of 80, your UX is better than 80% of the other products in its massive database.
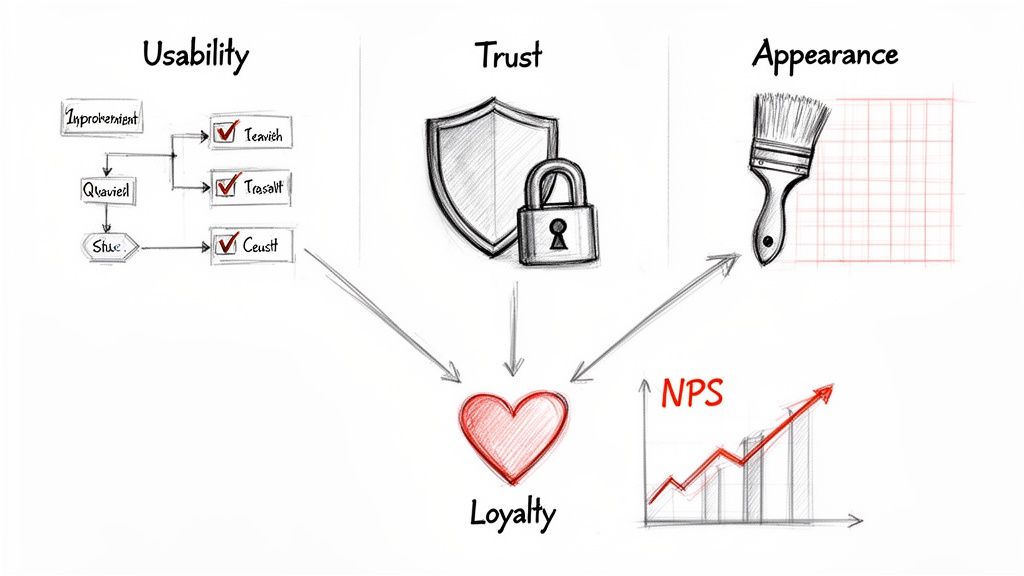
The Four Pillars of the SUPR-Q Score
The SUPR-Q framework is built on four core components. Each one gives you a different lens through which to see how users perceive your product.
Understanding these pillars is what helps product teams get past vague feedback like "I just don't like it." Instead, you get specific data pointing to a weak checkout flow, untrustworthy design cues, or a clunky interface.
For instance, a low score in the Trust pillar might tell you to take a hard look at your security badges or the clarity of your privacy policy. It’s this kind of diagnostic detail that makes prioritising fixes so much easier. A practical recommendation is to use a platform like Uxia to test how changes to these elements impact user perception before you ship them.
Below is a breakdown of what each component of the SUPR-Q actually measures.
Component | What It Measures | Example Question Focus |
|---|---|---|
Usability | The ease and intuition with which users can achieve their goals. This is the bedrock of a good user experience. | How easy is it to navigate the website? Can users find what they are looking for without struggling? |
Trust & Credibility | The feeling of security and trustworthiness a user has. This covers everything from professional design to clear security signals. | Do users feel comfortable providing personal information? Does the site appear credible and legitimate? |
Appearance | The visual appeal of the design. A polished, aesthetically pleasing interface can directly influence user perception. | Is the website visually attractive? Does the design look professional and modern? |
Loyalty | The likelihood of users returning and recommending the site to others. It often uses the Net Promoter Score (NPS) format. | How likely are you to recommend this website to a friend or colleague? |
With these four pillars, you get a much clearer picture of what to work on next.
A high SUPR-Q score is a powerful signal that your product doesn't just work—it creates a positive connection that drives users to come back and tell others about it.
This level of detail is exactly where you can make strategic design decisions that have a real impact. It allows you to use platforms like Uxia to pinpoint these problem areas and refine flows before they ever frustrate a real user.
How to Calculate Your SUPR-Q Score From User Data
So you’ve run a SUPR-Q questionnaire. What happens next? Turning that raw user feedback into a meaningful score is a straightforward process.
It all starts with the standard eight-item questionnaire. The first seven questions use a 5-point Likert scale (from "Strongly Disagree" to "Strongly Agree"), while the final one is the classic 11-point Net Promoter Score (NPS) question to gauge loyalty.
To get your raw score, you simply add up the responses from the first seven items. The eighth item, the NPS score, is kept on its own for now, but it's a key part of the loyalty component. This initial sum is your starting point, but the real magic comes from what you do with it.
Turning Raw Data Into a Percentile Rank
A raw score doesn't tell you much on its own. The real power of SUPR-Q is its normative database, which contextualises your score by comparing it against hundreds of other products.
Your raw score gets converted into a percentile rank. For example, if you get a score of 65, it means your website’s user experience is better than 65% of the websites in the database. Now that's a number you can take to your stakeholders.
This is how the core components feed into that final score.
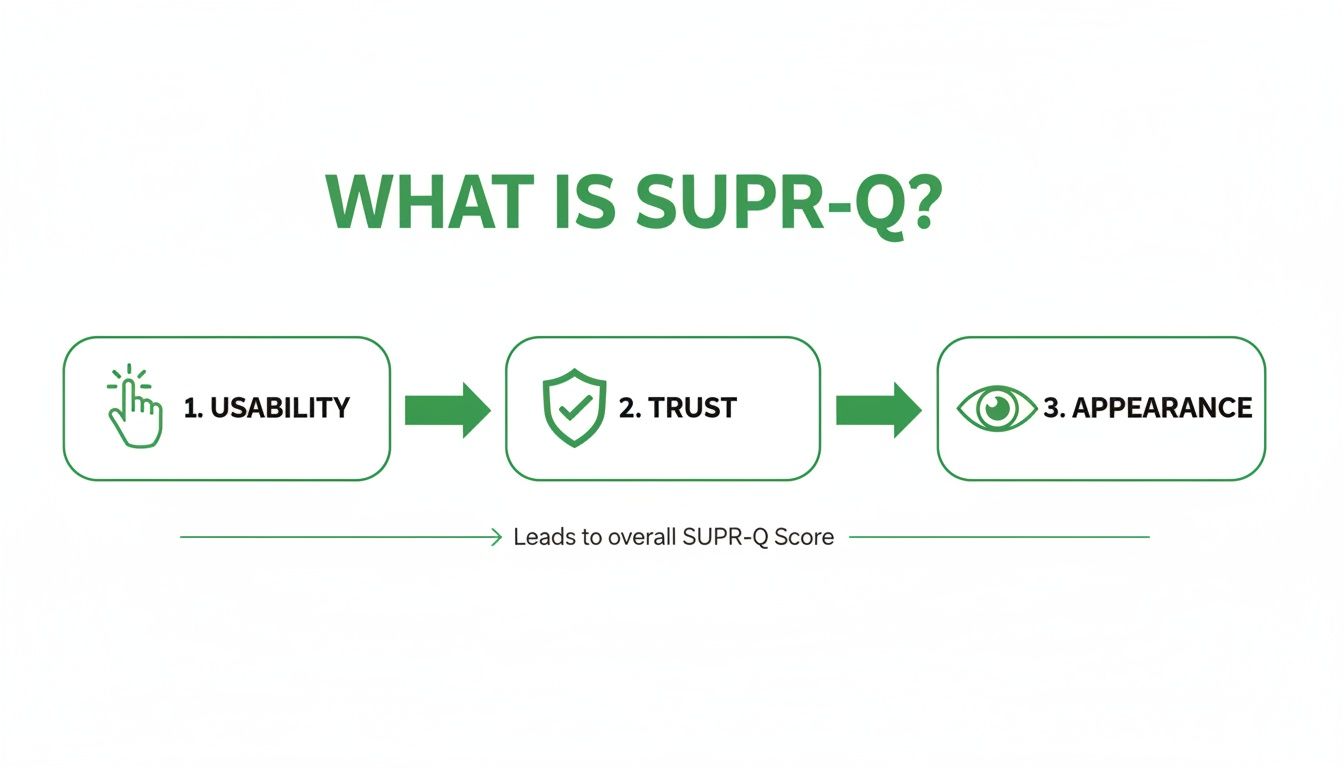
As the diagram shows, it all boils down to three pillars: usability, trust, and appearance. These are what shape a user's overall perception and, ultimately, their loyalty.
To make sure your score is reliable, you need a decent sample size—I always aim for at least 25-30 participants who genuinely represent your user base. And while the numbers are crucial, don't forget to pair them with qualitative insights from user interviews. They provide the "why" behind the "what". A practical recommendation: if you're drowning in interview recordings, it's worth looking into AI transcription software for interviews to speed up your analysis.
Remember, the SUPR-Q score is more than just a number; it's a diagnostic tool. A low score in 'Appearance' combined with a high score in 'Usability' tells a very specific story about where to focus your design efforts.
Once you have these numbers, you have a solid, data-driven foundation for making real improvements. We talk a lot more about this in our guide on incorporating data-driven design into your workflow.
This is also where a platform like Uxia comes in, helping you translate those quantitative findings into concrete design fixes by pinpointing exactly where users are struggling.
How to Project Your SUPR-Q Score with Uxia and Synthetic Testers
Calculating your SUPR-Q score from post-launch data is a great way to see where you stand. But what if you could project your score before you even start coding? Imagine building with confidence, knowing you’ve already addressed major UX issues.
That’s exactly what modern AI-powered platforms like Uxia are for. Forget the old, slow model of recruiting, scheduling, and paying human testers. With Uxia, you can get predictive insights in minutes, not weeks.
How Uxia Projects Your Score for a Flow
The process is surprisingly simple. You just upload your designs to Uxia—whether they're early Figma mockups or fully built-out prototypes.
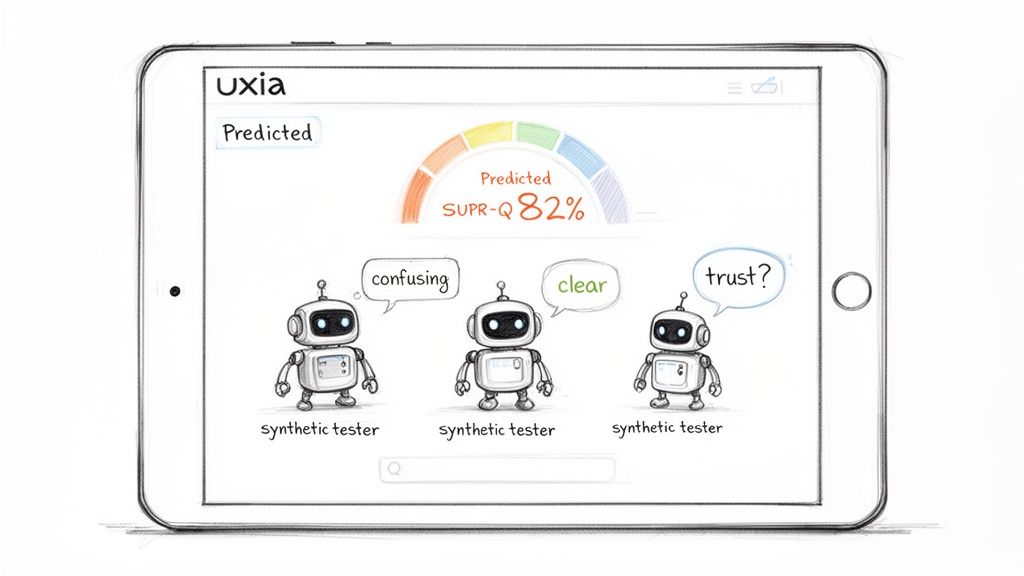
Next, you define a user flow and your target audience. Uxia then generates synthetic testers that precisely match those user profiles.
These AI testers then get to work, navigating your product and trying to complete key tasks, just like real users would. While they do, they provide a constant stream of think-aloud feedback, vocalising their thoughts on everything from usability hiccups to trust signals.
By analysing this rich feedback, Uxia generates a predictive assessment of your potential SUPR-Q performance for that specific flow. For example, if several synthetic users say a checkout process feels insecure, Uxia flags this as a direct threat to your Trust & Credibility score and provides a practical recommendation to add security badges or clearer copy.
This method transforms UX research from a reactive, backward-looking activity into a forward-looking, continuous validation engine. It’s about catching score-damaging issues before they ever impact a real user.
From Projection to Actionable Insights
The real magic here is the speed and detail. Instead of waiting weeks for a traditional study to wrap up, you get a prioritised list of issues in minutes.
Usability Bottlenecks: Synthetic testers will instantly flag confusing navigation, unclear calls-to-action, or any friction point in the user journey.
Trust & Credibility Gaps: The AI detects weak visual cues, unclear copy, or missing security signals that would lower your trust score.
Appearance Issues: You’ll get feedback on visual appeal and professionalism, helping you align your design with what users expect to see.
This allows your team to spot and fix problems right away, dramatically shortening your development cycles. It's a fundamental shift from traditional methods. You can see just how different it is in our detailed comparison of synthetic users vs. human users.
By using a platform like Uxia, you can reliably project your SUPR-Q score for key flows and, more importantly, build better products faster.
The Evolving UX Landscape and The Urgent Need for Speed
The pace of product development is accelerating, and user expectations are right there with it. The old way of doing UX research—with its long, drawn-out cycles of recruiting, testing, and manual analysis—is becoming a serious bottleneck. Teams simply can't afford to wait months for insights anymore.
This pressure is only getting more intense as new technologies go mainstream. Take generative AI, for example. Projections show that by 2026, a staggering 32.7% of people across the European Union will be using these tools. You can dig into the specifics in the full report on Europe’s digital future from Eurostat.
This isn't just a minor trend. It means designers are building for a user base that now expects smarter, faster, and more seamless interactions by default.
The Industry Shift Towards Efficiency
This new reality is forcing a complete rethink of how we conduct UX research. The whole industry is pivoting away from those slow, clunky methods and is quickly getting comfortable with faster, remote validation techniques.
Just look at the recent data on how comfort levels with agile methods have shot up:
First-click testing: Comfort has jumped to 84% (a 12-point increase).
Tree testing: Now at 81% comfort (a 9-point increase).
Card sorting: Comfort has climbed to 84% (a 6-point increase).
The message is loud and clear: product teams need tools that deliver solid insights, fast. To keep up with an AI-savvy audience, you have to iterate constantly, and legacy research processes just get in the way.
Speed is no longer a luxury in product development—it's an essential requirement for staying relevant. The teams that can validate and iterate on designs the fastest will be the ones that win.
This is exactly the problem that platforms like Uxia are built to solve. By swapping slow human studies for instant, AI-driven insights from synthetic testers, Uxia completely cuts out the research lag. A practical recommendation is to integrate Uxia into your design sprints to get feedback on prototypes within the same day, rather than waiting for the next sprint.
It gives teams the power to test, learn, and refine their designs in a matter of minutes, not months. This kind of rapid iteration is what it takes to build products that not only work but also deliver the experience modern users demand. Your SUPR Q score depends on it.
Actionable Strategies for Improving Your SUPR Q Score
Knowing your SUPR-Q score is one thing. Actually improving it is where the real work—and the real value—begins. A low score isn’t a dead end; it’s a roadmap showing you exactly where to focus.
This is where you can stop guessing and start fixing, turning data into tangible improvements. Let's break down how to tackle each component of the score.
Enhance Usability by Fixing Friction
If your Usability score is dragging everything else down, it's time to hunt for friction points. Instead of relying on assumptions, you can run unmoderated tests on your critical user flows right inside Uxia.
Our synthetic testers will immediately flag confusing navigation, awkward interactions, or dead ends. For example, if they consistently stumble during your checkout process, Uxia provides a prioritised list of issues. A practical recommendation here would be to fix the top three issues identified by Uxia, like making a hard-to-find "Apply Discount" button more prominent, to directly improve this core part of your SUPR Q score.
Build Trust Through Clarity and Security
A low Trust score almost always points to user hesitation. But what’s causing it? The think-aloud transcripts from Uxia’s synthetic testers give you the answer. These AI-powered users will verbalise their exact concerns as they navigate your site.
"I’m not sure what happens after I click this… it doesn't say if my information is secure."
Feedback like this is gold. It’s not a vague feeling; it's a specific, actionable insight. It tells you exactly where to add trust signals like security badges, clearer privacy policy links, or more transparent copy. Addressing these specific doubts builds the credibility you need to lift your score. Uxia helps pinpoint exactly where this hesitation occurs in your flow.
Refine Appearance with Rapid A/B Testing
Visual appeal isn't just about looking good; it directly impacts a user's perception of your product's quality and trustworthiness. With Uxia, you can A/B test different design variations without touching a line of code.
A practical recommendation is to upload two versions of a screen and let the synthetic testers evaluate them. You'll quickly see which design feels more professional and intuitive, helping you make evidence-based aesthetic choices that genuinely resonate. You can find out more about this process in our guide on achieving high usability issue detection with AI testers.
By methodically improving Usability, Trust, and Appearance, you create a far better overall experience. This naturally leads to higher Loyalty and an improved Net Promoter Score, boosting your entire SUPR Q performance.
Frequently Asked Questions About SUPR Q
Getting started with SUPR-Q often brings up a few practical questions. Here are the answers to some of the most common ones we hear from UX teams.
What Is a Good SUPR-Q Score?
A SUPR-Q score is a percentile rank, so a score of 50 means your user experience is better than half of the products in the database. That's the baseline.
A score above 75 is generally considered excellent, placing your product in the top quartile. But remember, a "good" score is always relative. A practical recommendation is to research the average SUPR-Q for your specific industry to set a more relevant benchmark for your team.
How Many Users Do I Need for a Reliable Score?
For a traditional study, you'll want at least 25-30 participants per user group to get stable, reliable results. If you’re using Uxia, you can run tests with its synthetic users, which eliminates sample size concerns related to recruitment and gives you instant, comprehensive feedback.
If you’re working on a high-stakes redesign or a critical product launch, I’d push for 50-100 users in a traditional study. That larger sample size gives you much greater statistical confidence in your findings.
How Often Should I Measure My SUPR-Q Score?
The best practice is to measure your SUPR-Q score on a regular cadence, like quarterly or biannually. This helps you track performance trends and catch any dips before they become major problems.
It's also absolutely critical to measure it after any major redesign to quantify the real impact of your changes.
With a platform like Uxia, you can continuously project the score impact of changes before they go live. This creates a proactive feedback loop, moving you from reacting to past performance to building for future success.
Ready to move beyond reactive testing and start building with confidence? With Uxia, you can get AI-driven insights in minutes to improve your user experience and project your SUPR-Q score. Sign up and start testing for free at https://www.uxia.app.